
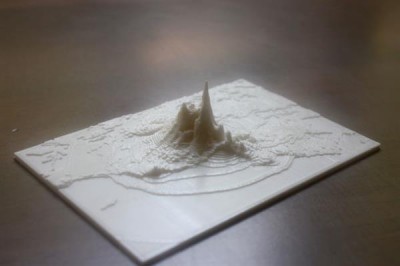
After creating a 3D printed shake intensity map of the 2014 South Napa earthquake two years ago, Oakland-based artist Doug McCune has published a guide to creating a 3D printed map of almost any earthquake from around the world.
In September 2014, artist Doug McCune was woken up by a 6.0 magnitude earthquake that struck Napa, California. It was the largest earthquake in the Bay Area since 1989. Although the quake caused little effect in San Francisco, where McCune was located, significant damage was caused in Napa. In an effort to understand the quake and the geographical spread of its impact, the artist downloaded the Peak Ground Velocity (PGV) data from the United States Geological Survey (USGS). With this data, McCune created a 3D printed map of the region, with the ground shake intensity depicted via the Z axis.
Two years on from the Napa earthquake, McCune has published an Instructables guide showing makers how they can create their own 3D printed topographic earthquake maps. Data for most earthquakes from around the world is freely available, so artists, geographers, and cartographers can simply download the data before turning it into a 3D model. McCune’s relatively simple tutorial consists of eight steps.


The first step to be taken when creating a 3D printed earthquake map is obtaining accurate data for the chosen quake. This data, says McCune, can best be sourced from USGS, which lists comprehensive downloadable data for real historical earthquakes as well as hypothetical ones based on “worst-case scenarios” for major fault lines. To get started on a 3D printed map, users need to source the shapefiles, usually no larger than a few megabytes, for their chosen quake.
For the second step, McCune recommends using QGIS to view the downloaded shapefiles as a map made up of polygons. “What you're looking at is a contour map, very similar to a topographic map of elevation,” McCune explains. “But instead of representing the elevation these contour lines represent the shaking intensity of the quake.”


To convert the digital map into a 3D model, McCune wrote his own tool called shp2stl, which is a NodeJS library. This tool can be used using NodeJS software. This is step three. The fourth step is to configure the project directory, the fifth is to configure JavaScript code, and the sixth involves running the script to generate an STL file ready for 3D printing.
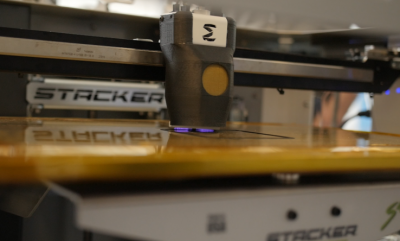
The seventh step of the project involves actually 3D printing the earthquake map. The generated STL file can be sliced and sent to the printer using any slicing software, and the print requires no supports since it is stacked from bottom to top with no overhangs. However, ensuring the map sticks to the print bed during printing is important. McCune himself uses a Type A Machines Series 1 Pro 3D printer.


The final (and optional) step of the 3D printing process involves clipping the model to the land border, removing any ocean that may be part of the map. Since the data makes no distinction between land and water, clipping off any water can make the model clearer. Makers can use QGIS to clip the polygons of the shapefile using simplified coastline shapefiles.
Not content to rest on his laurels, McCune has also attempt to 3D print maps of hurricane and tornado data.
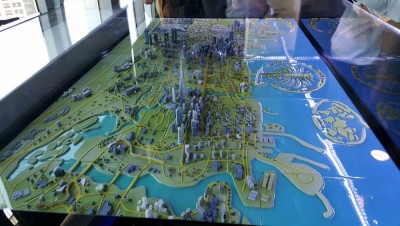
In recent years, 3D printing has been used to create various kinds of 3D map. The vast amount of geographical and topographical data available online has enabled designers to create huge 3D printed tactile maps of London and Tokyo, while 3D printed maps for the visually impaired are also becoming more common.


